

Retirement Savings Benchmarks Are a Dashboard, Not a Verdict
New Fidelity data show why retirement benchmarks are useful, but only when paired with savings behavior, healthcare-cost planning, and future flexibility.
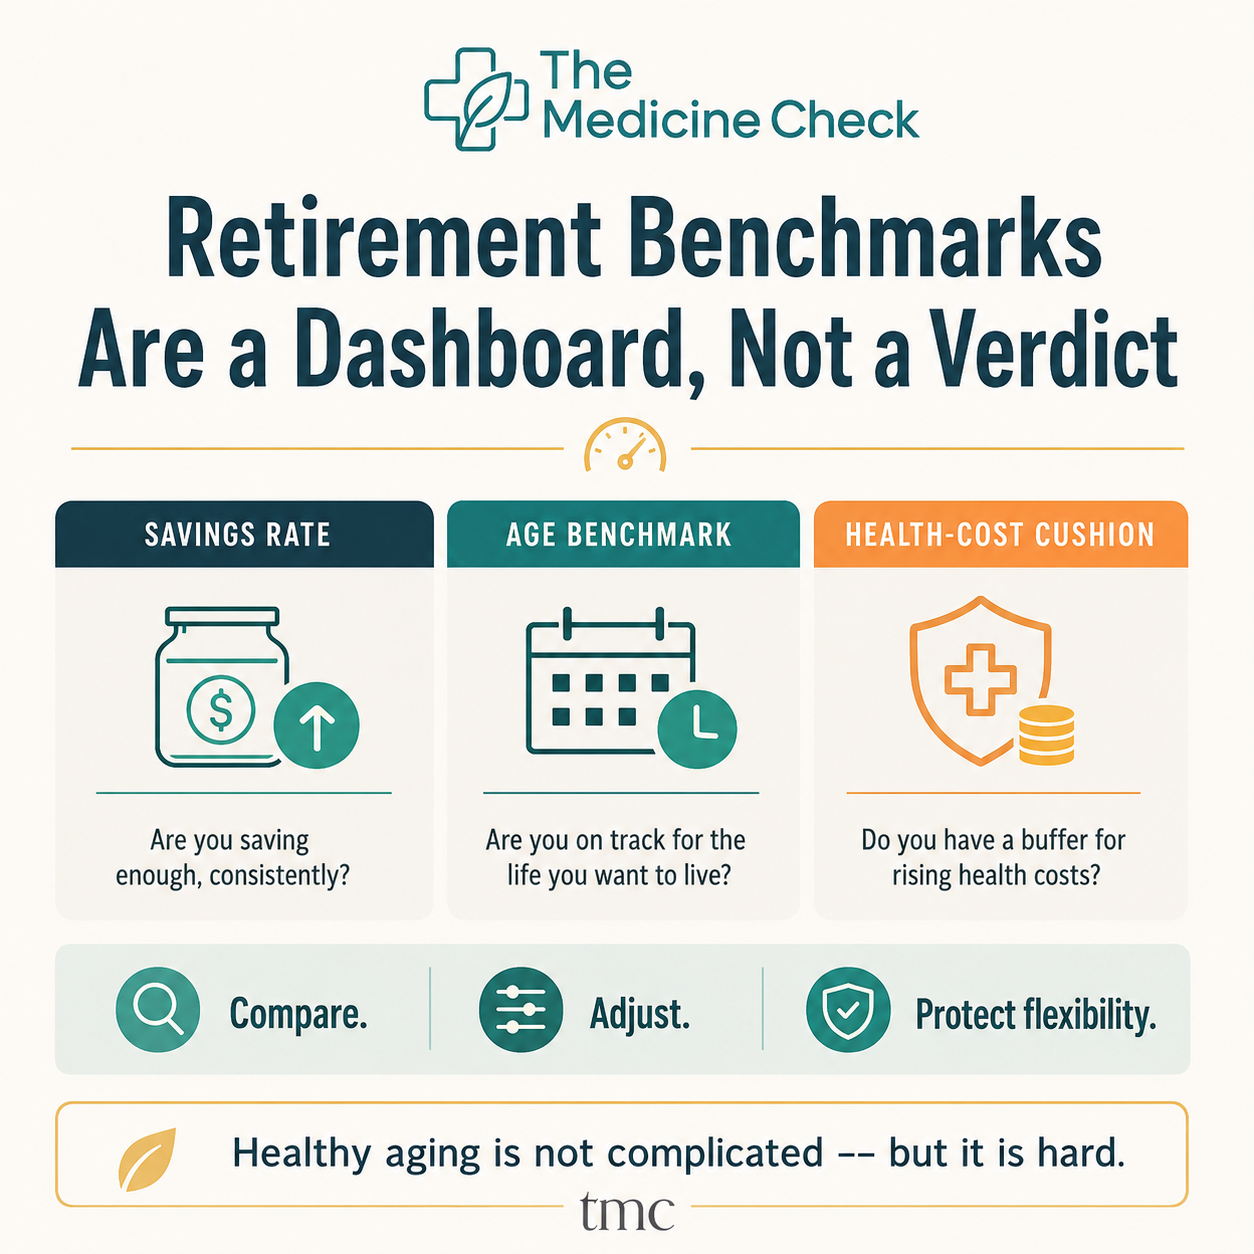
Infographic alt text: Square infographic titled "Retirement Benchmarks Are a Dashboard, Not a Verdict," showing three dashboard tiles for savings rate, age benchmark, and health-cost cushion, with a calm Wealthspan planning message.
The question is not whether your number is good enough
Retirement savings benchmarks can be useful, but they can also make people feel as if one number has already decided their future. This week's timely retirement data argues for a calmer reading. Fidelity's Q1 2026 retirement analysis, released May 28, 2026, found that average account balances dipped from the prior quarter as markets moved around. The average 401(k) balance was $141,000, down 4% from Q4 2025, while the average IRA balance was $131,380, also down 4%.
That sounds discouraging at first. But the same report showed a stronger long-term behavior signal: 401(k) and 403(b) total savings rates reached record levels, and the average 401(k) total savings rate hit 14.4%, close to Fidelity's suggested 15% combined employee-and-employer savings rate. Nearly one in five 401(k) participants increased their savings rate in the quarter, while only 5.7% changed their asset allocation.
For a Wealthspan reader, that is the real story. Benchmarks matter, but behavior matters more. A retirement number is a dashboard light. It should help you ask better questions, not conclude that you are either safe or doomed.
Why benchmarks still matter
June is a good time for a mid-year retirement check-in because enough of the year has passed to see whether savings habits are actually taking hold. Benchmarks by age can help people notice whether they are building enough future flexibility.
Fidelity's broad roadmap suggests saving at least 15% of income annually, including employer contributions, and aiming for savings equal to 10 times income by age 67. Its age-based guideposts are not a law of nature. They depend on assumptions about retirement age, income replacement, Social Security, investment returns, and spending. Still, they give households a practical way to ask: Are we moving toward enough future options?
The danger is treating an average balance as a personal target. Averages are pulled upward by larger accounts. They also do not tell you whether a person has a pension, home equity, debt, a spouse's savings, inherited resources, caregiving obligations, health risks, or multiple retirement accounts outside one provider's dataset. A benchmark can tell you where to look. It cannot tell you the whole story.
The better Wealthspan dashboard
A stronger retirement review uses three lenses:
First, look at the savings rate. The percentage being saved each year is often more actionable than the account balance. Fidelity's Q1 data showed the average employee contribution rate at 9.6% and the average employer contribution rate at 4.8%. That combined 14.4% savings rate is close to the 15% guideline, but individual households will vary.
Second, look at the age benchmark. A savings multiple, such as 1 times income by 30, 3 times by 40, 6 times by 50, 8 times by 60, and 10 times by 67, can be a directional check. If the gap is large, it may point to a need for a more detailed planning conversation, not a reason to give up.
Third, look at the health-cost cushion. Wealthspan is not just the size of the portfolio. It is the financial capacity to age with options: to fill prescriptions, keep follow-up care, adapt housing, pay premiums, handle a setback, and avoid being forced into worse choices because every dollar is already spoken for.
That health-cost cushion is where many retirement benchmark conversations are too thin.
Health costs belong in the retirement number
EBRI's 2026 Retirement Confidence Survey found that retirement confidence declined in 2026. Workers' confidence in having enough money to live comfortably throughout retirement fell to 61%, while retirees' confidence fell to 73%. Health care costs were one of the major pressure points: nearly 6 in 10 workers said health care costs were hurting their ability to save for retirement, and 2 in 5 retirees said health care expenses in retirement had been higher than expected.
KFF's recent Medicare affordability brief adds another reason to treat health costs as a Wealthspan issue. KFF reported that one in four Medicare beneficiaries had income below $24,600 per person in 2024. In 2023, Medicare beneficiaries spent an average of $6,459 out of pocket on health care costs, including premiums and services. KFF also projected that Medicare Part B premiums and deductibles will rise substantially between 2026 and 2034.
This does not mean every reader needs the same medical-cost reserve or the same retirement number. It means a retirement savings benchmark is incomplete if it ignores the expenses most likely to affect independence.
The catch-up window is real, but it is not magic
For readers in their 50s and early 60s, 2026 also brings concrete planning numbers. The IRS lists the 2026 elective deferral limit for traditional and safe harbor 401(k) plans at $24,500. If a plan permits catch-up contributions, participants age 50 or older may contribute an additional $8,000 in 2026. For employees age 60 through 63 in eligible plans, the higher catch-up contribution limit is $11,250.
Those limits matter because they create room for late-career acceleration. But the important caveat is affordability. The maximum contribution is not a moral standard, and it is not realistic for every household. A person carrying debt, supporting a family, managing medical bills, or rebuilding emergency savings may need a different sequence.
The educational takeaway is simpler: know the available room, then decide what fits the household without weakening the rest of the plan.
How to use benchmarks without panic
A practical Wealthspan check-in can be built around six questions:
What percentage of income is being saved this year, including any employer match?
Is that rate rising, flat, or slipping compared with last year?
How does the current retirement balance compare with a reasonable age-based guidepost?
What recurring health costs already compete with saving, such as premiums, prescriptions, dental care, vision care, or therapy?
What would happen if health costs or caregiving needs rose next year?
What one adjustment would improve flexibility without creating new fragility?
That last question matters. Wealthspan is not about chasing the biggest possible number in isolation. It is about preserving future choices. Sometimes the next useful move is increasing retirement contributions. Sometimes it is rebuilding cash reserves, paying down high-interest debt, reviewing insurance coverage, comparing medication costs with a clinician or pharmacist, or using an HSA appropriately before Medicare eligibility.
For readers who want a structured annual review, The Medicine Check Annual Wealthspan + Healthspan Checkup Tracker can help put savings, health markers, medications, prevention habits, and long-term planning in the same place: https://www.themedicinecheck.com/annual-wealthspan-healthspan-checkup-tracker
Evidence verdict
The evidence is strong enough to support a practical planning message, but not a one-size-fits-all prescription.
Fidelity's report is a large provider analysis of more than 54 million retirement accounts, which makes it useful for observing broad account-balance and savings-behavior trends. But it reflects Fidelity's account base, not every U.S. household.
EBRI's Retirement Confidence Survey is nationally relevant survey research, but it measures reported confidence, worries, and behaviors rather than proving which single financial strategy improves retirement outcomes. KFF's Medicare brief is a policy and data synthesis that clarifies affordability pressures among Medicare beneficiaries, but it cannot predict one person's future medical bills.
Taken together, these sources support a cautious conclusion: retirement benchmarks are useful, but they work best when paired with behavior, cash-flow reality, health-cost planning, and flexibility.
The bottom line
Retirement savings benchmarks should not be used as a verdict on your future. They should be used as a dashboard.
If the savings rate is improving, that is useful. If the age benchmark shows a gap, that is useful. If health costs are already squeezing the plan, that is useful too. Each signal gives you a place to ask a better question. A strong Wealthspan plan is not only about reaching a number. It is about preserving the financial flexibility to age well, pay for care, make healthy choices, and stay independent for as long as possible.
Keep Building Your Wealthspan
Estimate future medical costs with the Retirement Healthcare Spend Estimator.
Model savings decisions with the Retirement Savings Calculator.
Track both money and health trends in the Annual Wealthspan + Healthspan Checkup Tracker.
Sources
Fidelity Investments. Q1 2026 Retirement Analysis. Released May 28, 2026. https://about.fidelity.com/data-and-insights/q1-2026-retirement-analysis
Fidelity Investments. Retirement roadmap: 4 key retirement guideposts to help you stay on target. Updated July 10, 2025. https://www.fidelity.com/learning-center/personal-finance/retirement/retirement-roadmap
Employee Benefit Research Institute and Greenwald Research. 2026 Retirement Confidence Survey Finds Americans Less Confident About Retirement as Worries Grow Over Social Security, Medicare and Rising Costs. Published May 2026. https://www.ebri.org/publications/research-publications/center-publications/content/summary/2026-retirement-confidence-survey-finds-americans-less-confident-about-retirement-as-worries-grow-over-social-security--medicare-and-rising-costs
KFF. Key Facts About Health Care Affordability for People With Medicare. Published May 2026. https://www.kff.org/medicare/key-facts-about-health-care-affordability-for-people-with-medicare/
Internal Revenue Service. Retirement topics - 401(k) and profit-sharing plan contribution limits. Accessed June 7, 2026. https://www.irs.gov/retirement-plans/plan-participant-employee/retirement-topics-401k-and-profit-sharing-plan-contribution-limits